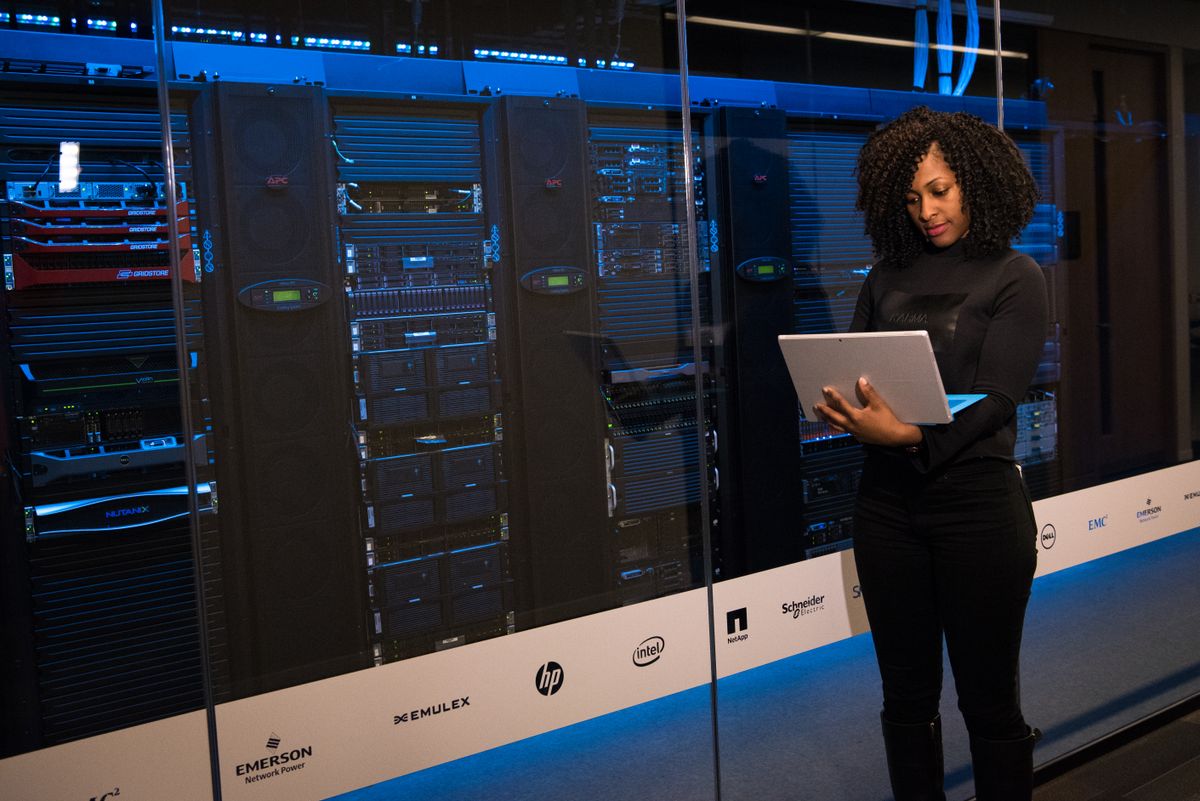
Infrastructure Management • Unified Monitoring

Your Entire IT Estate. One View. Zero Blind Spots.

Tech9labs exploits the gap between high‑cost enterprise suites and inexpensive utilities – a comprehensive monitoring platform for virtual servers, VDI, networks, desktops, databases and applications from a single pane of glass, at a cost just above freeware. Agent and agentless. Every platform. One view.

10+Platform classes monitored
2Modes – agent + agentless
1Single pane of glass
Compute & VirtualizationVirtual • Physical • VDI • Endpoints
vSphere
Hyper‑V
XenServer
VDI
Workstations
UNIX
Network • Storage • AppsAny SNMP / Syslog device
Switches
Firewalls
Databases
Storage
Exchange
Logs
Single Pane of GlassEverything, one view
Agent + AgentlessSNMP • Syslog • APIs
Just Above FreewareEnterprise features
Everything We Monitor – From One View
Virtual ServersvSphere • Xen • Hyper‑V
Physical ServersWin • Linux • UNIX
VDIXenDesktop • View
ApplicationsExchange • SAP • WAS
DatabasesSQL • Oracle • MySQL
Log ManagementSyslog • Traps
NetworksSwitch • FW • LB • VPN
StorageIBM • HP • EMC • NetApp
DatacenterSNMP / Syslog devices
WorkstationsWindows • Linux
Virtual ServersvSphere • Xen • Hyper‑V
Physical ServersWin • Linux • UNIX
VDIXenDesktop • View
ApplicationsExchange • SAP • WAS
DatabasesSQL • Oracle • MySQL
Log ManagementSyslog • Traps
NetworksSwitch • FW • LB • VPN
StorageIBM • HP • EMC • NetApp
DatacenterSNMP / Syslog devices
WorkstationsWindows • Linux
Platforms & Services

One Platform for Total Infrastructure Visibility

From hypervisors to legacy UNIX, from firewalls to storage arrays – Tech9labs monitors your entire estate with enterprise features at a cost just above freeware.

Unified infrastructure monitoring Unified Monitoring

Single‑View Infrastructure Monitoring

Monitor virtual servers, physical servers, VDI, networks, desktops, databases and applications from one central view – closing the gap between expensive enterprise suites and basic utilities.

vSphereHyper‑VXenServerWindowsLinuxUNIX
Capacity planning and reporting dashboards Reports & Dashboards

Custom Reports & Capacity Planning

Out‑of‑the‑box and custom reports for infrastructure health, capacity planning around memory & storage utilization, security reporting, uptime & chargeback – with dynamic, graph‑based dashboards.

Capacity PlanningChargebackUptimeTrending

Log Management

Centralized Syslog & trap collection from any device – search, correlate and report for security and compliance.

SyslogSNMP Traps

Network & Storage Monitoring

Switches, routers, firewalls, load balancers, VPNs – plus IBM, HP, EMC, Dell, NetApp and EqualLogic storage arrays.

SNMPAll vendors

VDI & Workstations

XenDesktop, XenApp and VMware View farms plus Windows & Linux desktops – per‑user performance visibility.

XenDesktopVMware View

Applications & Databases

Exchange, SQL, MySQL, IBM WAS, SAP, AD, Oracle EBS, BES – service‑level health for the apps the business runs on.

SAPOracle EBS
The Gap We Close

High‑Cost Suites vs Tech9labs Monitoring

Enterprise suites cost a fortune; freeware utilities see almost nothing. We deliver the comprehensive middle – enterprise features at a cost just above freeware.

Dimension
High‑Cost Enterprise Suites
Tech9labs Managed Monitoring
Coverage
Vendor‑locked modules, add‑on fees
vSphere to SCO‑UNIX – 10+ classes, one view
Deployment
Heavy agents, months‑long projects
Agent + agentless (SNMP/Syslog/APIs) – live in days
Reports
Paid add‑on reporting packs
OOTB + custom reports included – health, security, chargeback
Dashboards
Static, admin‑only views
Dynamic, graph‑based, real‑time utilization & alerts
Capacity & Chargeback
Separate tools & consultants
CPU/memory/storage/disk I‑O trending + chargeback built in
Cost
$$$ licensing + annual maintenance
Enterprise‑grade, priced just above freeware
Enterprise features. Freeware‑adjacent pricing.
Agent + agentless – ultimate flexibility & control.
Solution Explorer

Explore What We Monitor

Click a pill to see coverage, metrics and outcomes for each domain.

Compute, Covered
Virtual & Physical Server Monitoring
Deep metrics across every hypervisor and OS you run – from modern vSphere clusters to legacy UNIX boxes nobody else will touch.
3
Hypervisor platforms
7+
OS platforms
100%
Estate coverage
  • VMware vSphere, Citrix XenServer, Microsoft Hyper‑V
  • Windows, Linux, HP‑UX, Solaris, Ubuntu, IBM‑AIX, SCO‑UNIX
  • CPU, memory, storage & disk I/O trending per host/VM
  • Uptime, alerting & capacity utilization out of the box
vSphereXenServerHyper‑VAIXSolaris
Server monitoring
End‑User Experience
VDI & Workstation Monitoring
When VDI slows down, the business stops. Monitor farms and desktops with per‑user visibility – before users call the helpdesk.
3
VDI platforms
Per‑user
Visibility
Win + Linux
Desktops
  • Citrix XenDesktop, XenApp & VMware View farm health
  • Login times, session latency & resource contention
  • Windows & Linux workstation monitoring
  • Asset inventory & patch‑level visibility
XenDesktopXenAppVMware ViewWindowsLinux
VDI and workstation monitoring
Service‑Level Health
Application & Database Monitoring
The infrastructure exists to run applications – so we monitor the applications. Service‑level health for the platforms your business lives on.
8+
App platforms
All major
Databases
E2E
Service view
  • MS Exchange, MS SQL, MySQL, IBM WAS, SAP, AD, Oracle EBS, BES
  • Database health, connections & query performance
  • Service availability & response monitoring
  • App‑to‑infrastructure dependency mapping
ExchangeSAPOracle EBSIBM WASAD
Application and database monitoring
Any Device, Any Vendor
Network & Storage Monitoring
If it speaks SNMP or Syslog, we monitor it – switches to firewalls, load balancers to every major storage array in your datacenter.
SNMP
+ Syslog native
6+
Storage vendors
Full path
LAN → WAN → DC
  • Switches, routers, firewalls, load balancers & VPNs
  • IBM, HP, EMC, Dell, NetApp, EqualLogic storage
  • Port, bandwidth & error trending
  • Any datacenter component via Syslog/SNMP
CiscoNetAppEMCFortinetF5
Network monitoring
Every Event, One Place
Log Management
Centralized collection, search and correlation of logs from every device – turning syslog noise into security reports and audit evidence.
Central
Collection
Real‑time
Search
Retention
Policies
  • Syslog & SNMP trap ingestion from any device
  • Correlation across network, servers & security
  • Security reporting for audits & compliance
  • Retention, archival & fast forensic search
SyslogSNMP TrapsSecurity Reports
Log management
Data → Decisions
Custom Reports & Dynamic Dashboards
Out‑of‑the‑box reports for health, capacity, security, uptime & chargeback – plus a custom builder and live graph‑based dashboards for every stakeholder.
50+
OOTB reports
Custom
Report builder
Live
Dashboards
  • Capacity planning around memory & storage utilization
  • CPU / memory / storage / disk I‑O trending per host & VM
  • Uptime & chargeback reporting for finance
  • Dynamic dashboards – utilization, alert status, graphs
CapacityChargebackUptimeSecurity
Reports and dashboards
Ultimate Flexibility

Agent‑Based + Agentless. Your Choice.

We bring tools that give you ultimate flexibility, visibility and control – deep agents where you want depth, zero‑footprint agentless where you want simplicity.

Agent‑Based MonitoringDeep, OS‑level visibility

Lightweight agents deliver process‑level depth for the workloads that matter most – inside Windows, Linux and Unix virtual and physical machines.

  • Windows VMs & physical servers
  • Linux & Unix VMs (incl. AIX, Solaris, HP‑UX)
  • Process, service & application‑level metrics
  • Secure, low‑overhead, centrally managed
Agentless MonitoringZero footprint, full coverage

Monitor without installing anything – via SNMP, Syslog messages and native hypervisor integration. Ideal for appliances, network gear and restricted hosts.

  • SNMP polling & traps from any enabled device
  • Syslog message ingestion datacenter‑wide
  • Hypervisor APIs – VMware ESX/ESXi & Citrix XenServer
  • No agents to deploy, patch or police
2Monitoring modes
1Unified console
10+Platform classes
≈FreePriced just above freeware
Infrastructure reporting and capacity planning Reports • Dashboards • Chargeback
From Metrics to Management

Reporting That Runs Your Datacenter

Out‑of‑the‑box reports analyze IT infrastructure health, drive capacity planning around memory and storage utilization, support security reporting, and produce uptime & chargeback data – for virtual hosts, VMs, storage and physical servers alike.

  • CPU, memory, storage & disk I/O trending per host, VM & array
  • Capacity planning before shortages become outages
  • Security reporting for audits & compliance teams
  • Uptime & chargeback data for finance & leadership
  • Dynamic dashboards – resource utilization, alert status, graphs
50+OOTB reports
100%Customizable
Real‑timeDashboards
How We Deliver

From Blind Spots to Full Visibility

A proven rollout – discover, deploy, baseline, report and optimize.

01
Discovery & Inventory

Auto‑discover every virtual host, physical server, VDI farm, network device, storage array and application – nothing missed.

02
Agent + Agentless Deployment

Agents where depth matters; SNMP/Syslog/hypervisor APIs everywhere else – live in days, not months.

03
Baselines & Thresholds

Learn normal CPU, memory, storage & I/O behavior per workload; alert on meaningful deviation, not noise.

04
Dashboards & Reports

Dynamic dashboards for ops; OOTB + custom reports for capacity, security, uptime and chargeback.

05
Alerting & Response

Correlated alerts with escalation workflows and 24×7 managed response – incidents fixed before users notice.

06
Capacity & Optimization

Trending and forecasting drive right‑sizing, chargeback and budget decisions – continuous optimization.

Client Success

Visibility Wins

Real outcomes from unified infrastructure monitoring delivered and managed by Tech9labs.

Manufacturing data center
Auto Components Manufacturer (9 plants)
400 Heterogeneous Assets, One Pane of Glass
vSphere and Hyper‑V clusters alongside legacy AIX and SCO‑UNIX boxes – three tools, zero unified view, and constant surprise outages.
Solution Delivered
  • Single‑view monitoring across all 10 platform classes
  • Agentless SNMP/Syslog for legacy UNIX & network gear
  • Agents on Windows/Linux VMs for deep metrics
  • Capacity dashboards with disk I/O & memory trending
Unified MonitoringAgentlessUNIX
100%
Estate visibility (was 40%)
One view
60%
Faster MTTR
Correlated alerts
35%
Capacity cost avoided
Right‑sizing
3→1
Tools consolidated
Lower cost
BFSI reporting
Regional Bank (12 departments)
Automated Chargeback & Compliance Reporting
Finance demanded per‑department IT chargeback; compliance demanded security reports – both were built manually in spreadsheets, weeks late.
Solution Delivered
  • Uptime & utilization chargeback reports per department
  • Security reporting from centralized log management
  • Dynamic exec dashboards for leadership
  • Scheduled, automated delivery – zero manual effort
ChargebackLog MgmtDashboards
100%
Chargeback accuracy
Usage‑based
40+
Reports automated monthly
Zero manual
90%
Less reporting effort
OOTB + custom
99.99%
Uptime tracked & proven
SLA evidence
Hospital VDI monitoring
Hospital Network (1,500 clinicians)
XenDesktop VDI – Monitored Before It Hurts
Clinicians logging in at 7 AM faced slow VDI sessions; every slowdown became a helpdesk ticket and a patient‑care delay.
Solution Delivered
  • XenDesktop farm health + per‑user session metrics
  • Login‑time & latency baselines with smart alerts
  • Storage I/O trending to fix backend contention
  • 24×7 managed monitoring with proactive fixes
VDIXenDesktop24×7
99.9%
VDI availability
Proactive fixes
45%
Faster login times
Baselines
70%
Fewer VDI tickets
Alert‑first
1,500
Clinicians served daily
Happy users
Why Tech9labs

Monitoring Expertise, Unmatched

We exploit the gap between high‑cost enterprise suites and inexpensive utilities – and you get the comprehensive middle.

Single Pane of Glass

Virtual, physical, VDI, network, storage, apps – one central view for your whole estate.

Agent + Agentless

Deep agents where needed; SNMP, Syslog & hypervisor APIs everywhere else.

Every Platform

From vSphere to SCO‑UNIX, AIX & Solaris – we monitor what others won't touch.

Just Above Freeware

Enterprise‑grade features at a fraction of enterprise suite pricing.

Custom Reports

OOTB + custom – health, capacity, security, uptime & chargeback.

Dynamic Dashboards

Live, graph‑based views of utilization, alert status and trends.

Capacity Planning

Memory & storage utilization trending that prevents outages and overspend.

24×7 Managed Monitoring

We watch the dashboards, answer the alerts and own the SLA – you run the business.

Enterprise Visibility. Freeware‑Adjacent Cost.

Get a free infrastructure visibility assessment – we'll inventory every asset, show you your blind spots, and stand up single‑view monitoring with reports and dashboards your whole team will actually use.

Let's Build Something Together

Partner with Tech9labs to transform your enterprise IT infrastructure. Our experts are ready to help.

Talk to Our Experts

Free consultation & strategy session

Looking for a trusted partner to manage and optimize your IT operations? Our consultants will help you design the right managed services strategy tailored to your enterprise.

  • Free Consultation

    No-obligation strategy session with senior architects.

  • Infrastructure Assessment

    Comprehensive audit of your current IT environment.

  • IT Operations Roadmap

    Custom transformation plan aligned with business goals.

  • Service Transition Planning

    Seamless migration with zero business disruption.

Call Us +91 93555 04757
Email Us marketing@tech9labs.com
Working Hours Mon - Fri, 9:00 - 18:00 IST
Secure & Confidential